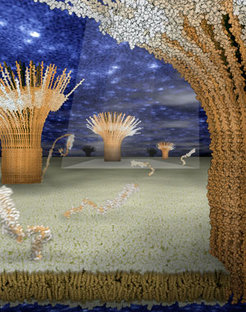
Providing scientifically meaningful illustrations that at the same time captivate the observer is a challenge of its own. Here are some attempts.

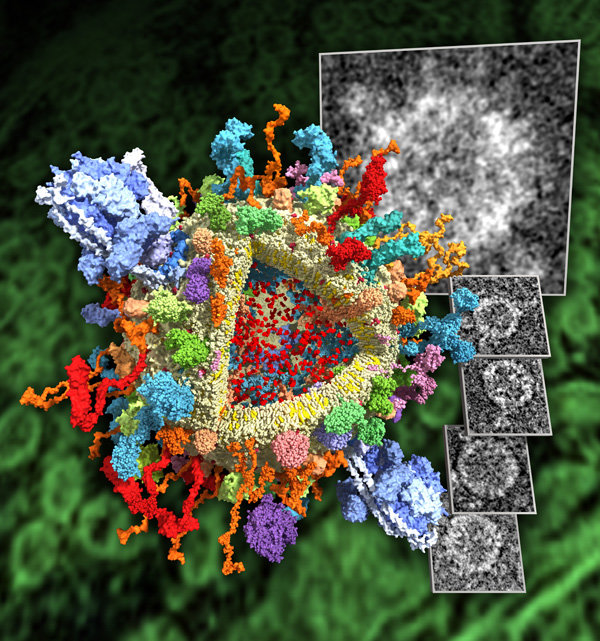
![Our 2006 image of a synaptic vesicle (see picture at the bottom of this page) made it to the front page!](/4276572/original-1670428622.jpg?t=eyJ3aWR0aCI6MjQ2LCJvYmpfaWQiOjQyNzY1NzJ9--27a57268c111178716f14df91dc90f12ef8990d7)
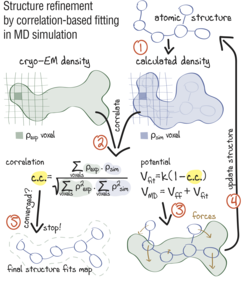
![Approach: using correlation-based refinement in MD simulation to steer the atomic positions of a macromolecule such that they optimally fit a cryo-EM map. The molecule is subjected to a global biasing potential Vfit in addition to the MD force field Vff. The forces resulting from Vfit act on every atom to enhance the real-space correlation coefficient 𝑐.𝑐. between the cryo-EM density (green) and the density calculated from the current atomic positions (blue). The first step (1) is to generate a simulated density by convoluting the atomic positions with a three-dimensional Gaussian function of width 𝜎 (Orzechowski and Tama, 2008). The two maps are correlated (2), and the biasing forces are calculated. These forces are then added to the standard MD force field (3), and new atomic positions are evaluated (4). Steps (1–4) are repeated, yielding a structure that correlates better with the cryo-EM map than the starting structure. Sketch made with Adobe Illustrator.](/631936/original-1552322822.jpg?t=eyJ3aWR0aCI6MjQ2LCJvYmpfaWQiOjYzMTkzNn0%3D--666f8572e6da8627e55f24c004a66c1eed26d789)
Approach: using correlation-based refinement in MD simulation to steer the atomic positions of a macromolecule such that they optimally fit a cryo-EM map. The molecule is subjected to a global biasing potential Vfit in addition to the MD force field Vff. The forces resulting from Vfit act on every atom to enhance the real-space correlation coefficient 𝑐.𝑐. between the cryo-EM density (green) and the density calculated from the current atomic positions (blue). The first step (1) is to generate a simulated density by convoluting the atomic positions with a three-dimensional Gaussian function of width 𝜎 (Orzechowski and Tama, 2008). The two maps are correlated (2), and the biasing forces are calculated. These forces are then added to the standard MD force field (3), and new atomic positions are evaluated (4). Steps (1–4) are repeated, yielding a structure that correlates better with the cryo-EM map than the starting structure.
Sketch made with Adobe Illustrator.
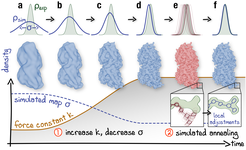
![Schematic representation of the proposed continuous refinement protocol: (1) a low temperature optimization phase, where Vfit is monotonously increased by increasing the force constant 𝑘 (columns a–d), followed by (2) simulated annealing (columns e, f). The local effect of the protocol is exemplified in the upper row for a one-dimensional single-atom case. Simulated densities shown in the middle row were generated using the atomic structure of a tubulin dimer (PDB ID: 3JAT; Zhang et al. (2015)). Sketch made with Illustrator.](/631940/original-1552323140.jpg?t=eyJ3aWR0aCI6MjQ2LCJvYmpfaWQiOjYzMTk0MH0%3D--f7e65b290a95fec150622616f6cddc5d21c62f69)
Schematic representation of the proposed continuous refinement protocol: (1) a low temperature optimization phase, where Vfit is monotonously increased by increasing the force constant 𝑘 (columns a–d), followed by (2) simulated annealing (columns e, f). The local effect of the protocol is exemplified in the upper row for a one-dimensional single-atom case. Simulated densities shown in the middle row were generated using the atomic structure of a tubulin dimer (PDB ID: 3JAT; Zhang et al. (2015)). Sketch made with Illustrator.
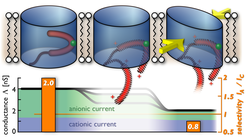
![Suggested Model of VDAC Voltage-Induced Gating. At zero transmembrane potential, the VDAC pore (blue) most likely remains in the open state (upper, left). Increasing the membrane voltage beyond ± 30 mV (center) exerts a force on the N-terminal helix (red), which is attached to the barrel wall by the contact residue L10 (green). Detachment or removal of the N-terminal helix from the barrel wall at the L10-V143 contact leaves behind a labile, hull-like pore structure (right) which is more susceptible to undergo (semi)collapse under membrane stress. At an ellipticity of 0.47, the semicollapsed barrel geometry displays the conductance and ion selectivity found experimentally for the wild-type closed state (lower, right), whereas our calculations reproduce the wild-type open state values for noncollapsed structures containing the N-terminal helix (lower, left). Note that semicollapse can also occur under membrane stress when the helix is not removed yet with a smaller probability. Hatching of the N-terminal region in the upper central and right panels indicates that the conformation of a possibly detached N terminus is not known.](/631933/original-1536596691.jpg?t=eyJ3aWR0aCI6MjQ2LCJvYmpfaWQiOjYzMTkzM30%3D--54d572010a1d74c2136c6d251921863df0b9a477)
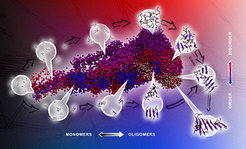
![This illustration was prepared as the graphical abstract for the paper Driving forces and structural determinants of steric zipper peptide oligomer formation elucidated by atomistic simulations (J. Mol. Biol., 2012). It shows the projection of sampled conformational ensembles in atomistic molecular dynamics simulations of the spontaneous aggregation process of the PHF6 steric zipper peptide from the tau protein. The employed mapping technique is based on collective coordinates and each region of the projection corresponds to a distinct conformational state, as indicated by the representative conformational ensembles. Spheres in close spatial proximity in the projection represent configurations with high structural similarity. The color shades encode conformations from different independent simulations and highlight the similarities and differences in the conformational states and assembly pathways in the oligomerization process of the amyloidogenic peptide sequence. Tools: Pymol, Adobe Illustrator, Keynote.](/631949/original-1348070480.jpg?t=eyJ3aWR0aCI6MjQ2LCJvYmpfaWQiOjYzMTk0OX0%3D--5b9308041fcb222834ff2a764b1f4becc9962edc)
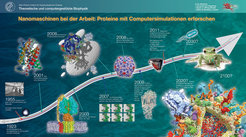
![This poster was created to present our department at the open house day in November. Tools: Adobe InDesign, Photoshop.](/631976/original-1348070480.jpg?t=eyJ3aWR0aCI6MjQ2LCJvYmpfaWQiOjYzMTk3Nn0%3D--eb9d8135752b368bbc9bd80eb15b0b5233c335c4)
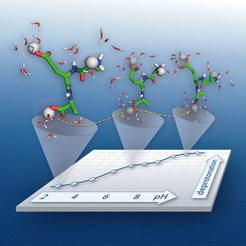
![The titration curve of a tripeptide of sequence Ala-Glu-Ala is obtained by performing constant pH molecular dynamics simulations in explicit solvent at different pH values. The protonation states of the titratable groups of the tripeptide (N-terminus, Glu, and C-terminus) are allowed to change dynamically during these simulations. The changes in protonation are governed by electrostatic interactions with the local environment as well as the pH of the solution. In the figure, the peptide is shown in its most probable protonation state at selected pH values (2, 6, and 10). Tools: Pymol, Apple Numbers, Adobe Illustrator.](/631963/original-1536595891.jpg?t=eyJ3aWR0aCI6MjQ2LCJvYmpfaWQiOjYzMTk2M30%3D--0cfd7a639645cb41f246f4a07bf342240cc8b381)
![The artistic model shows the self-organization of syntaxin-1 molecules into clusters. While most syntaxins are assembled in such clusters, single molecules diffuse freely between the clusters. Tools: Adobe Photoshop.](/631955/original-1348070479.jpg?t=eyJ3aWR0aCI6MjQ2LCJvYmpfaWQiOjYzMTk1NX0%3D--a47fda5a2b3db04a304f18309984372b213ec7d9)
![This is a molecular model of a synaptic vesicle filled with neurotransmitters (red). The membrane (yellow) of the vesicle is packed with functional proteins, as, e.g., SNARE complexes (red/orange) that help in the vesicle fusion process, and ATPases (blue), which provide the energy for the organelle. The small gray images on the right hand side show electron microscopy images of real synaptic vesicles, the big gray image simulates how the molecular model would appear if imaged by an electron microscope.](/631931/original-1670427730.jpg?t=eyJ3aWR0aCI6MjQ2LCJvYmpfaWQiOjYzMTkzMX0%3D--a9ec7fce9b5e8c39c93c9594c1660b85d70d11b9)