Constant pH Molecular Dynamics Simulations


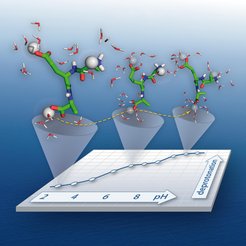
Typically, in a molecular dynamics (MD) simulation, the protonation states of ionizable groups of a protein are set at the beginning of the simulation. This presetting is not always an obvious task, in particular for histidine, as its pKa is close to the physiological pH. In contrast, in a constant pH MD simulation, the protonation state of an ionizable group of a protein is allowed to change during the simulation according to the local electrostatic environment and the actual pH of the solution.
In this model, the protonation state of an amino acid changes continuously by propagating the motion of a virtual particle (usually referred to as “λ-particle”) that interpolates between different protonation Hamiltonians in explicit solvent MD simulations. The pKa values of the ionizable groups can then be obtained from the distributions of the protonation states.
The Three State Model
Amino acids such as aspartate (Asp), glutamate (Glu), or histidine (His) have two atoms that can carry a proton: two oxygen atoms for Asp and Glu and two nitrogen atom for His, respectively. To ensure correct representation of such residues, we developed a “three state model” that includes two protonated and one deprotonated form for Asp and Glu and one protonated and two deprotonated forms for His, respectively (Dobrev et al. 2016).
Validation
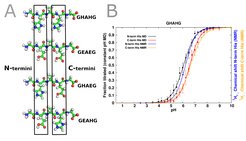
Our approach to calculate the protonation states has been tested in a recent study using challanging control pentapeptide systems. In comparison with results from NMR titration experiments, our method is suitable to not only reproduce the correct pKa values in those systems but also to determine the direction of the shift from their reference values in solution (Dobrev et al. 2020).

Simulation at constant pH
The downloadable movie is a 5 ns constant-pH MD simulation (pH=4) of the turkey ovomucoid third domain in water. The acidic amino acids Asp and Glu are drawn with sticks. They appear in red colour as negatively charged (deprotonated) and in blue colour as positively charged (protonated) residues, respectively. The proton is illustrated as a ball.
Constant pH MD simulation of turkey ovomucoid third domain in water
Constant pH MD simulation of turkey ovomucoid third domain in water
Average protonation state of the acidic amino acids of turkey ovomucoid third domain

This animation shows the average protonation state (blue=protonated, red=deprotonated) of the acidic amino acids of turkey ovomucoid third domain at different pH values. The plot shows the extent of deprotonation as a function of pH: the titration curve of the protein. The higher the affinity of the protein for the protons, the more the titration curve is shifted to the right. From the titration curve, the apparent pKa values of the amino acids are obtained.


