Sequence retrieval, alignment and phylogenetic trees
Introduction to protein sequence retrieval and analysis
The last lecture gave an introduction into protein sequences
(or primary structures), and we have learnt which information can be
extracted on the sequence level. In short, these include:
- protein function prediction (when a homologue with known function is
annotated)
- secondary structure prediction (from the amino-acid propensities
in the sequence)
- tertiary structure prediction (when a homologue's structure is
known)
- identification of conserved (and possibly functionally or
structurally essential residues), by alignment with related sequences
- prediction of hereditary information, by alignment with related sequences
Today, we will focus on the last two aspects, as structural analyses
will follow later. First we will analyse the peptide hormone
insulin.
Multiple sequence alignment of insulin
As you may know, insulin is essential for normal metabolism,
as it stimulates glucose uptake after a meal. Malfunction of insulin
leads to diabetes, which is characterized by decreased glucose
tolerance resulting from a relative deficiency of insulin (or,
alternatively, a lack of sensitivity to insulin on the receptor side).
If you are interested in more background information on diabetes, here
is a good source.
For a sequence analysis of insulin, we obviously first need its sequence.
For this, we visit the SWISS-PROT database, which can be accessed via
Server. Please open the ExPASy web page in another browser window
(right click -> open in new window in mozilla), follow the
"Swiss-Prot and TrEMBL" link (first link under "Databases"), and
search for "insulin". As you will see, there are hundreds of matches,
but none directly corresponds to human insulin. This is because on the
sequence level, insulin is stored as a precursor. After synthesis, the
precursor protein is then split into the A and B chain that together
form the active form of insulin. Thus, we select the sequence of the
human insulin precursor : INS_HUMAN (P01308).
The SWISS-PROT entry of human insulin starts with some general
information on the sequence, starting with basic entry information,
the name and origin of the protein, literature references connected
with this sequence, and some comments concerning the function. This
section is followed by a number of cross-references to other databases
concerning insulin, like for example the Protein Data Bank (PDB),
where protein structures are stored. As we can see, lots of structural
information on insulin is available. In the section entitled
"Features", we can learn how the precursor sequence is related to the
active form of the hormone. As can be seen, the first 24 residues are
a signal sequence, followed by a stretch of 30 residues (25-54) that
corresponds to the B chain of insulin, and residues 90-110 make up the
A chain of insulin. Also annotated in the SWISS-PROT entry are a
number of natural mutations, leading to different forms of diabetes.
Finally, near the bottom of the page we find the sequence. Click on
the link on the bottom-right of the page to retrieve the sequence in
the so-called "FASTA" format. This is the sequence as we will feed it
to BLAST. Prepare the sequence for copy-and-paste to the BLAST window by
selecting the sequence (without the top title line) with the mouse and
activate "copy" in the mozilla "Edit" menu.
Now we open a new browser window to run BLAST, which also can be accessed
Server. On the right half of the screen, under "Tools and software
packages,", you'll find a line "Similarity searches [BLAST]". Click on
BLAST, paste your sequence, and run BLAST with the default parameters.
After some time, we obtain the 100 database sequences closest to the human
insulin (precursor), sorted to their level of similarity. Select all sequences,
by clicking the button
"Select up to" and then the checkbox next to the last sequence. After that, from the drop-down menu next to the button
"Submit query", hit "Retrieve sequences (FASTA format)" and hit
"Submit query".
We now get presented the raw sequences in FASTA format. Select all
sequences for copy-and-paste, and open a new browser window at the European Bioinformatics
Institute from which we will run the multiple alignment server.
Question: Using BLAST, the selected
sequences have already been aligned, to assess the similarity to our
target sequence. Why do we need to do another alignment?
Try to
answer the question, and check if your idea matches our answer.
On the Services site of the EBI, under "C", click on
"ClustalW". Paste your sequences in the window and run ClustalW with
the default parameters. Depending on the load on the server, ClustalW
will take a while to complete. The results window shows an informative
header, with the number of sequences that was aligned and some other
statistics, followed by the actual alignment. Press the "Jalview"
button for an instructive, detailed view of the alignment. To focus on
conserved residues, under "Calculate", click "Conservation". This way,
those residues that are highly conserved get highlighted.
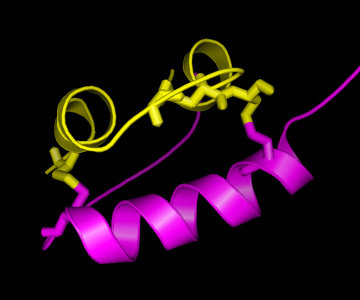
On the right, a picture of the insulin structure is shown, with the A
chain in yellow and the B chain in magenta. As can be seen, there are
two "bridges" connecting the A and the B chain, formed by Cysteine (C)
residues on both chains. This is an important structural feature of
insulin, strongly stabilising the structure. Therefore, it can be
easily understood that these C residues are among the strongly
conserved residues in the hormone. As is known from other structural
studies, residues interacting with the insulin receptor include:
the N-terminus of the A-chain (G-I-V-E), the C-terminus of the A-chain
(Y-C-N), and the C-terminus of the B-chain (G-F-F-Y), so also for
these residues there is a clear reason for their conservation. For the
other conserved residues, the reason for their conservation is less
clear, although their mutation has shown altered activity, hence
indicating a functional role.
Phylogenetic analysis of hemoglobin
Another application of multiple sequence analyses is the derivation of
evolutionary information, in particular the analysis of common ancestors
among different species, and their grouping (also known as taxonomy)
based on sequence similarity. This analysis is known as phylogenetic
analysis, and trees representing the sequence relationships are known
as phylogenetic trees.
In this course we will generate two phylogenetic trees, and compare
the results, to see if the mutational pattern in the one protein
(and the associated phylogenetic tree) is similar to that of the
other. For this we will take the alpha and beta chain of hemoglobin.
Hemoglobin is the universal oxygen transporter in nature. It takes up
oxygens in the lungs (or gills for fish) and transports it via the
blood in red blood cells to the brain, muscle, or another destination
in the body where oxygen is required. In fact, the reason why blood is
coloured red is because of the hemoglobin. Hemoglobin contains iron,
which in that particular state is colored red, nut unlike rust.
Although part of the same protein, the two sequences of the alpha and
beta chain have evolved
independently, and hence, two separate phylogenetic trees can be constructed.
For the sequence retrieval, we follow the same sequence as we have
done above for insulin, first for the human hemoglobin alpha chain (search
for "human hemoglobin alpha"), and then for the hemoglobin beta chain.
The sequence to select for the alpha chain is HBA_HUMAN (P69905), for the beta
chain it is HBB_HUMAN (P68871).
In the BLAST search, search for "Eukaryota" only.
From the BLAST results, select only the sequences that start with HBA,
and HBB, respectively (i.e. no HBD or HBA2, etc); the easiest way to
achieve this is to select all
sequences and then to deselect the undesired sequences. Paste the sequences
in the ClustalW window, and this time, before hitting "run", select
"phylip" as "tree type" under "phylogenetic tree". After some
computation time, the EBI server will show the tree. Keep the ClustalW
window for the alpha chain open and repeat the procedure for the beta
chain. By default, the results are presented in a "cladogram", which
enables easy comparison of the individual groups. If you'd like to
have a time estimate along the horizontal axis (as an indication of
the difference between the sequences end hence the time evolved since
the diversion from a possible common ancestor), right-click on the
tree, and under "format", click "phylogram".
Questions:
- Which species are most similar to human?
- Why are no Chimpanzee sequences listed? answer
- How related are humans to rabbits (RABIT), and the pacific walrus (ODORO)?
- How does this example illustrate that it is dangerous to derive a
phylogenetic tree from the sequences of a single protein? hint
OPTIONAL
If time allows, build a phylogenatic tree of a very different protein
(like a ribosomal elongation factor or F1-ATPase and compare the
result to that of hemoglobin.
Enjoy!