Simulation of Fluorescence Anisotropy Experiments
Gunnar F Schröder and Helmut Grubmüller
The labeling of proteins with fluorescent dyes is a widely used technique for studying the function of proteins e.g. by fluorescence anisotropy or FRET (fluorescence resonance energy transfer) experiments. Dyes are typically attached to proteins via a flexible linker to reduce interference with the protein and thus to ensure orientational averaging with FRET experiments. For the interpretation of such fluorescence spectroscopy experiments a proper description of the dye dynamics is essential.
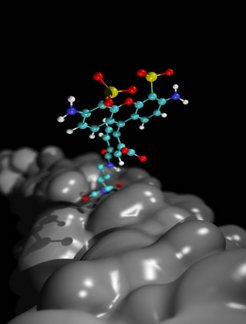
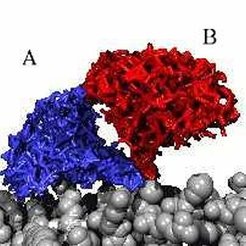
Here, we study the dynamics and conformations of the dye Alexa488 attached to the Sx225 position of the SNARE (Soluble NSF Attachment protein REceptor) protein complex. An hierarchical approach is presented that enables exhaustive sampling of the dye conformations. Two dominant conformations of the dye were determined. To additionally estimate the occupancy of these two states, a free-energy calculation was performed. The fluorescence anisotropy decay curves of the dye for both states from 1.5 ns trajectories were calculated and compared to the single molecule spectroscopy experiments.
Conformational search
A hierarchical approach of three steps has been developed to overcome the sampling problem. The main idea is to start with a simplified but efficient description and to proceed with increasingly detailed, and thus expensive, description:
- Step 1: Only 5 degrees of freedom for the dye, electrostatics as mean-field
- Step 2: Full dye dynamics, electrostatics as mean-field
- Step 3: Full dye dynamics, explicit solvent
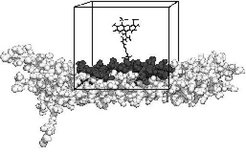
Step 1
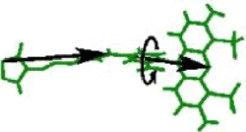
The conformational space of the system is projected on the 5 dimensions describing the most important degrees of freedom of the dye (see figure above). This reduced conformational space is exhaustively sampled in steps of 10° resulting in a grid of about 17 million gridpoints. The lowest energy structures are plotted in Figure 2.
Step 2
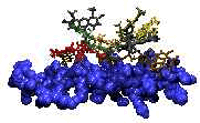
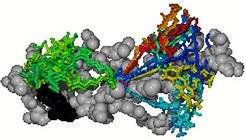
Eleven MD-simulations starting from randomly chosen starting positions were performed, yielding to a few clusters of low energy conformations (see Figure 3).

Step 3
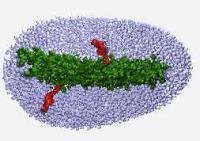
The hitherto identified conformations are subsequently used as starting structures for explicit solvent MD-simulations to obtain refined conformations (see Figure 4).
Free energy calculation
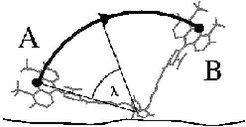
The occupancy of the two identified dye conformations is given by the free-energy difference which is obtained from thermodynamic integration [1]. Here, the dye is forced to move during an MD simulation from state A to state B along a circular reaction pathway, which is described by the reaction coordinate &lambda (see figure on the right). A free-energy difference of about 1kcal/mol is obtained, which leads to an occupancy of A: 15% and B: 85%. The barrier height is about 1 kcal/mol. Thus, the mean transition time is expected to lie within the nanosecond range.
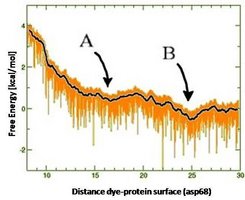
Estimation of entropy DS and enthalpy DH differences:
The entropy difference is calculated using two different methods:
- Principal component analysis
- A new simplex-method
The enthalpy difference is estimated from the averaged potential energy landscape.
entropy difference: S_A - S_B = -18 kcal/mol
enthalpy difference: H_A - H_B = -10 kcal/mol
⇒ A is enthalpically and B entropically favoured.


