Dynamic Force Spectroscopy of Molecular Adhesion Bonds
Financial Support: DFG Grant GR 1590/1-2

Atomic force microscopy, biomembrane force probe experiments, and optical tweezers applications allow to measure the response of single molecules to mechanical stress with high precision. Such experiments, due to limited spatial resolution, typically access only one single force value in a continuous force profile that characterizes the molecular response along a reaction coordinate.
We develop a theory that allows to reconstruct force profiles from force spectra obtained from measurements at varying loading rates, without requiring increased resolution. Spectra obtained from measurements with different spring constants contain complementary information.
Figure 1
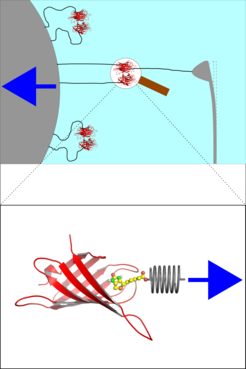
In typical force probe experiments, shown in Figure 1, the molecule under study is connected to a 'spring', e.g., a laser trap or an AFM cantilever (grey), often via a flexible polymer linker. Subsequently, that spring is moved away from the molecule with velocity v (blue arrow), which determines the loading rate. During that process the maximum force the molecule can withstand - the yielding force - is recorded through the deformation of the spring.

Figure 2
This situation can be described by a time-dependent free energy landscape U(x,t) (thin solid lines) along a reaction coordinate x, which is shown for two instances, before and at yielding (τ) in Figure 2.
Figure 2a: U(x,t) involves the free energy landscape U0(x) (bold) of the unperturbed system, and a semi-harmonic potential Vpull (x,t) (dashed) that describes the external force exerted onto the studied molecule. Figure 2b: The fraction Pv(t) of bound states (dotted) and the unbinding flux dt(t) (dashed) define the yielding position and determine which part of the force profile F(x)=dx U0(x) (solid) is probed via Fyield (hatched area). For pulling velocities v>0, the minimum of U0 +Vpull is raised with time as sketched in the Figure, and the barrier impeding transitions is reduced accordingly. Thus, the flux across the barrier is increased, such that transitions are accelerated.
Figure 3
Using Kramers theory, a relation between the maximum force and pulling velocity can be obtained. This correlation allows to reconstruct the energy landscape U0(x) from dynamic force spectra, F(v).

Here, a stiff spring scenario as discussed above has to be distinguished from the case of a soft spring: In the latter case the transition state, x*, is shifted towards the left due to the spring potential already before the transition occurs. This has to be taken into account and, in fact, is the dominant effect for soft springs.
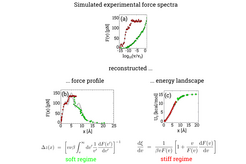
Figure 3 shows a sample study for both, the soft (green) as well as the stiff spring regime (red). Through numerical solution of the Smoluchovski equation, experimental force spectra have been simulated (top row). From these data, the underlying force profile (bottom, left) and energy landscape (bottom, right) have been reconstructed using the transformations given below. The original force profile and energy landscape are shown in black for reference. For a detailed description of the mathematics, see the publication given below.


