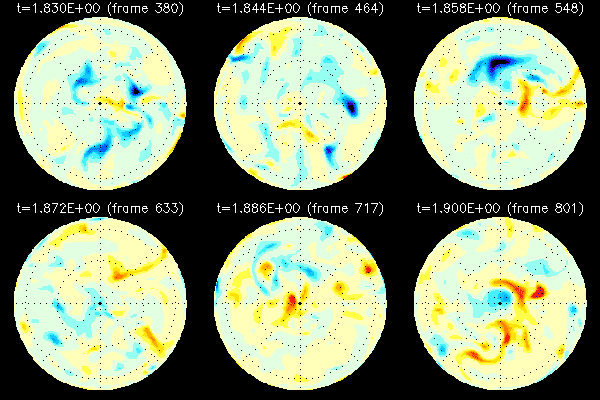
Time-Evolution of the Earth's Magnetic Field During a Simulated Reversal
Shown is the radial magnetic field of our Earth-like dynamo (chemical convection at E = 3x10⁻⁴, Pm = 3, Ra = 35 times critical). Red colors positive, blue negative values. The animations cover the time interval from Fig. 8 of Kutzner and Christensen (2002) [3], see also Fig. 9 therein. Time t above the animations is given in magnetic diffusion time.

Fig. 1: This animation shows the field as it would appear at the surface of the Earth. Contour step is 0.0055.
© C. Kutzner

Fig. 2: Field at the core-mantle-boundary (CMB), contour step is 0.29. View onto the north pole of the CMB. Notice the strong flux patches that form above the pole at time t=1.866. They are due to expulsion of toroidal field by an upwelling plume.
© C. Kutzner

Fig. 3: Field at the CMB, contour step is 0.29. View onto the south pole of the CMB.
© C. Kutzner
Publications
Simulated Geomagnetic Reversals and Preferred Virtual Geomagnetic Pole Paths
Geophys. J. Int. 157 (3): 1105–1118, 2004
Untersuchung von Feldumkehrungen an einem numerischen Modell des Geodynamos
Dissertation, Georg-August-Universität Göttingen, 2003
From Stable Dipolar Towards Reversing Numerical Dynamos
Phys. Earth Planet. Int. 131 (1): 29–45, 2002
Effects of Driving Mechanisms in Geodynamo Models
Geophys. Res. Lett. 27 (1): 29–32, 2000
Numerische Simulationen zum Geodynamo: Einfluß verschiedener Antriebsarten auf Strömung und Magnetfeld
Diplomarbeit, Institut für Geophysik, Universität Göttingen, 1999


