Dynasome: How Does Protein Dynamics Relate to Function
We have developed a comprehensive dynamics space for protein dynamics based on 34 observables that can be obtained from molecular dynamics simulation1. Distances in this space serve as a measure for protein dynamics similarity which, in turn, allows to quantify structure-dynamics and dynamics-function relationships. We find that dynamics contain significant information that is not accessible from structure alone. Detailed analysis of the population of the dynasome space indicates that proteins of similar function tend to populate the same regions of the dynamics space or, in other words, tend to perform similar dynamics. This supports the intuitive assumption that protein dynamics is often directly related to function mechanismsberen2. It furthermore opens the door to dynamics based function prediction. Such predictions, based on similarity, crucially depend on the amount of data they are based on. For the larger function classes we obtained correct annotations in 19 out of 51 cases (46%), whereas smaller groups were within the limit of noise. The in average significant rate of positive predictions, expected to increase as more data becomes available, shows that the dynasome descriptors do indeed identify functionally relevant motion pattern. The position a protein occupies in the dynasome uniquely identifies its motion pattern, making the dynasome coordinates a unique dynamics fingerprint for each protein.
Protein function depends on dynamics


Similar proteins carry out similar function. Whether or not two proteins are similar can be determined on the basis of sequence, structure, or dynamics. Sequence and structure similarity are commonly used in function prediction1 whereas dynamics similarity has, despite the expected tight correlation to function, thus far not been systematically exploited. Reasons tor this are the scarceness of protein dynamics data, which has only recently been relieved by the availability of large scale molecular dynamics simulations, and the lack of a general measure for protein dynamics to quantify dynamics similarity2. The aim of this study is to develop a comprehensive dynamics space based on molecular dynamics data. The euclidean distances in this space offer a similarity measure that allows to quantify structure-dynamics and dynamics-function correlations. If such correlations are significant they would i) validate our approach and ii) allow for dynamics-based function prediction.
A similarity metric for protein dynamics
 distinguishes slow from fast movingproteins.")

We performed 0.1μs explicit water molecular dynamics simulations on a set of 112 structurally diverse proteins and determined from the trajectories 34 nonredundant observables, listed left, that capture different aspects of global protein motions and their underlying energy surface, while being mostly unrelated to protein structure. Large RMSD deviations and first PCA eigenvalues indicate, for example, a wide low energy basin, whereas high friction constants, obtained from fitting a damped harmonic oscillator to the auto correlation function, point towards fast motions with little positional memory. The ruggedness of the potential is quantified by comparing the velocity at which proteins sample the conformational space. The resulting 112 vectors, each of 34 dimensions, were then subject to principal component analysis (PCA) to identify linear combinations of observables, the dynasome descriptors, that capture the data in few dimensions and span the dynasome space. The first resulting descriptor is based on ensemble properties that differ rigid and flexible proteins, independent of the timescale at which they explore the conformational space. Descriptor 2 describes the ruggedness of the free energy surface and separates proteins based on how fast they explore the conformational space. PCA yields 34 descriptors, however, the first two readily explain 1/3 of the total variance and allow visual inspection of the data, as shown below.
Dynamics space is continuously populated

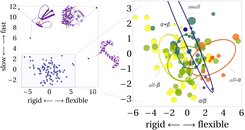
From the projection of our proteins onto the first two dynasome descriptors (the first two eigenvectors in our dynamics space) one can readily identify proteins whose dynamics are quite different from most others. Calmodulin, which is extremely flexible, appears to the right whereas the two snake toxins Erabutoxin A+B which have extraordinary rigid structures show up on the left top region. DNA polymerase consists of a endonuclease and a polymerase domain and is the only multi-domain protein in our set. It's dynamics are accordingly quite different from all other proteins, it samples a very smooth but wide free energy surface which leaves it in the top right corner in our plot. The majority of the proteins populate the dynamics space in a continuous fashion without apparent clusters. Coloring of proteins according to scop classes (right) shows a clear separation between all-α (red, more flexible) and all-β (yellow, more rigid) proteins. Small proteins, which is the most diverse class,reach from slow and flexible to fast and rigid, whereas α+β and α/β are centered around average dynamics with great overlap to all-α and all-β proteins.
Protein dynamics relates to function
. Proteins of similar function populate similar regions of the graph. Legend includes dynamics fingerprints of function classes.")

To study the fine-structure of the distribution we translated the distances in dynamics space into a network of neighborhood relations where two proteins are connected if they are mutually within the first 4 nearest neighbors. The resulting network is a faithful representation of the distances in dynamics space. Aggregates that are loosely connected to the network indicate a native clustering of protein dynamics. Proteins with similar function show a clear tendency to locate in similar regions of the graph which is highlighted for the 3 largest classes.
Functionally similar proteins are dynamics neighbors

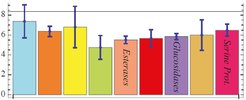

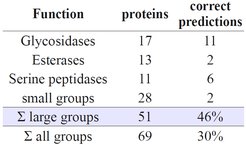
The average graph-distance between proteins of the same function is significantly lower than the average distance between two proteins, offering direct protein function prediction based on molecular dynamics. If the dynamics of a given protein are known, one can predict its function from the position in the dynamics space by assuming it matches the function of the nearest-by function class, which is given as the average distance to all members of that class. This simple approach yields 46% correct function predictions for the three largest function classes. The more scarcely sampled classes with 6 or less member proteins did not yield significant predictions and lowered the over-all rate to 30%. This rate should increase as dynamics data of more proteins becomes available. Information encoded in dynamics pattern is complementary to structural data and its incorporation improves structure based prediction.